Mission
The mission of the D. Bradley McWilliams School of Biomedical Informatics (SBMI) at UTHealth Houston is to educate future scientists and professionals in biomedical informatics and health information technology, conduct informatics research to improve health care and advance biomedical discovery, and develop advanced informatics tools to solve problems in health care
Student Achievement
The McWilliams School of Biomedical Informatics currently monitors student achievement utilizing retention and graduation rates, as well as job placement. The SBMI Office of the Associate Dean for Academic and Curricular Affairs, Academic Program Coordinators, Director of Student Affairs, the Curriculum Committee, and the Admission, Progression and Graduation Committee are involved in monitoring and evaluating student success throughout their programs of study. The Academic Coordinators review student records to identify individual student progression through the programs of study, the filing of degree plans, as well as student drops, incomplete grades, and failure to continue to register for courses. The Admissions, Progression and Graduation Committee also monitors the progression of students through the program.
In accordance with Texas Higher Education Coordinating Board definitions, the graduation rate for the McWilliams School of Biomedical Informatics was determined using a 5-year completion rate for the Masters Programs and a 10-year completion rate for the Ph.D. programs.
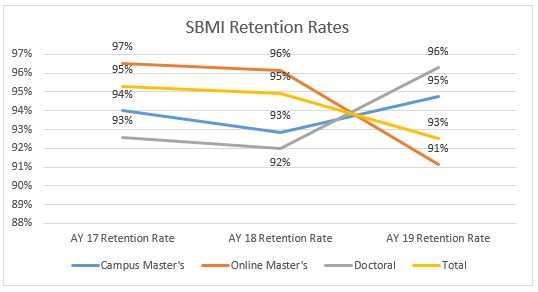
The overall SBMI student retention rates for the three most recently completed academic years are 95, 95, and 93 percent respectively, across all degree programs, as shown in Tables 8.1.a, 8.1.b, and 8.1.c, as well as Figure 8.1.a below. Thus, SBMI is meeting its target retention rate of 90 percent. The target was set at 90 percent because our data clearly shows we have a high retention rate. School leadership will take corrective actions should any retention rate drop below the threshold of 80 percent.
Impact of COVID-19
The majority of master’s students (greater than 70%) already attended classes in the online environment prior to the shift to entirely virtual courses at SBMI. In Spring 2020 a total of 6 students were unable to complete their courses in spring 2020. This is not an increase over semesters prior to the pandemic. No students were delayed in their graduation due to an inability to complete requirements. SBMI recorded no instances of students discontinuing their studies due to COVID.
Program Retention Rates
SBMI Program Retention Rates AY 2017 (9/1/16-8/31/17)

SBMI Program Retention Rates AY 2018(9/1/17-8/31/18)

SBMI Program Retention Rates AY 2019(9/1/18-8/31/19)

SBMI Overall Program Retention Rates (AY 17 – AY 19)
SBMI M.S. Program
The SBMI master’s program is offered face-to-face on campus or entirely online, as a full-time student or as a part-time student. The master’s program is primarily delivered (>70% of students) in the online environment to part-time students. For example, in Fall 2018, of the 122 enrolled master’s students, 98 (80.3%) were taking courses part-time. In Fall 2019, of the 132 enrolled master’s students, 106 (80.3%) were taking courses part-time. This is not surprising given that 52.5 percent of SBMI entering students already possess either a graduate degree or a professional (MD, PharmD, etc.) degree, with many employed full-time while pursuing additional SBMI education to enhance their careers. When reviewing the retention and graduation rates below, please note that the retention rates are calculated year over year, using the total number of master’s students enrolled as the denominator and those who discontinued or were dismissed as the numerator. The graduation rate is calculated using the number of students who matriculated in a given academic year as the denominator and those who have graduated as a numerator. However, given the large percentage of part-time students, some of whom only take a single course per semester, SBMI cannot view a graduation rate as complete until the full 5 year timeframe has passed. It should also be noted that master’s students can study for up to 8 years as a part-time SBMI student.
M.S. Retention Rates by Gender
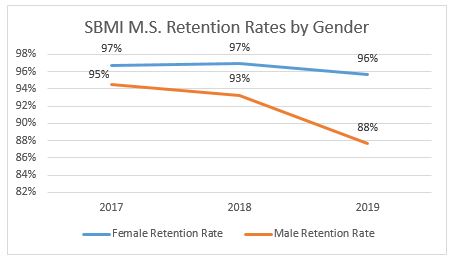
The SBMI master’s retention rates by gender meet the SBMI target rate, with the exception of the male retention rate for AY 2019, as seen in Table 8.1.d and Figure 8.1.b below. The retention rate for female students remains very high, above 95 percent for the most recent three years. The 5 percent drop from AY 2018 to AY 2019 for the male students was unexpected, but it could be due to a change in the academic policies where a single F earned in a course now results in dismissal from SBMI. Prior to Fall 2018 the policy allowed 3 F’s before the student was dismissed. The retention rate by gender for each academic year will continue to be monitored. Should the rate for male students remain under 90 percent for a second year, SBMI will undertake monitoring on a semester by semester basis and explore remediation for the male students who struggle.
SBMI M.S. Retention Rates by Gender (AY 17 – AY 19)

SBMI M.S. Retention Rates by Gender (AY 17 – AY 19)
SBMI M.S. Retention Rates by Race and Ethnicity
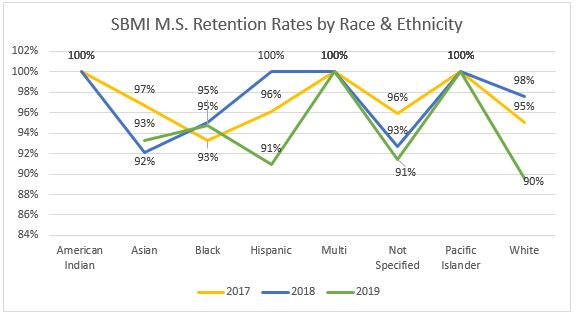
The breakout of SBMI retention rates by race and ethnicity are found in Table 8.1.e and Figure 8.1.c. In all Academic Years and for all races and ethnicities, the retention rates are above the 90 percent threshold. In AY 2019, the retention rate for Whites was at the target rate of 90 percent. SBMI will continue to monitor retention rates by race and ethnicity.
SBMI M.S. Retention Rates by Race and Ethnicity (AY 17 – AY 19)

SBMI M.S. Retention Rates by Race and Ethnicity (AY 17 – AY 19)
SBMI M.S. Graduation Rates
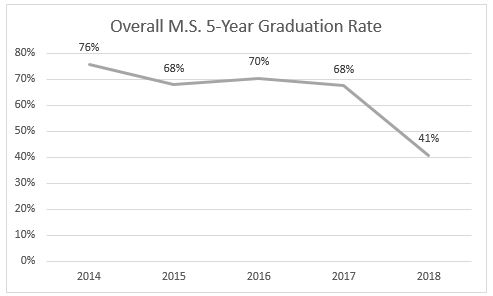
In accordance with Texas Higher Education Coordinating Board definitions, the graduation rate for the McWilliams School of Biomedical Informatics was determined using a 5-year completion rate for the masters programs. Because of the 5 year timeframe, additional years of data are shown. SBMI has set a target rate of graduating 70 percent of SBMI master’s enrollees within five years. The threshold requiring corrective action for the master’s program graduation rate is 60 percent. The overall 5-year graduation rate can be seen in Table 8.1.f and Figure 8.1.d. In AY 2014 and 2016, the target was met, while it was not met for AY 2015, 2017, and 2018. The rates for 2015 and 2017 do not meet the threshold for corrective action. It should be noted that the student profile for the SBMI master’s student is skewed to adults returning to school for additional education, while many have a full-time job and family. Additionally, Texas endured Hurricane Harvey in Fall 2017 causing many to reduce their workload due to personal or professional needs. Because of this, the 5 year graduation rate for the students entering the master’s program in 2018 will continue to be monitored. Should the final rate remain below 60 percent, a further analysis will be conducted to determine the reasons and develop a corrective action plan. It is also noted that, while Texas reviews the 5-year graduation rate, SBMI allows students to study part-time for 8 years in the master’s program.
SBMI M.S. 5-Year Graduation Rate

SBMI 5-Year Graduation Rate
SBMI M.S. Graduation Rates by Delivery Method
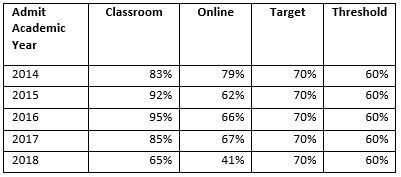
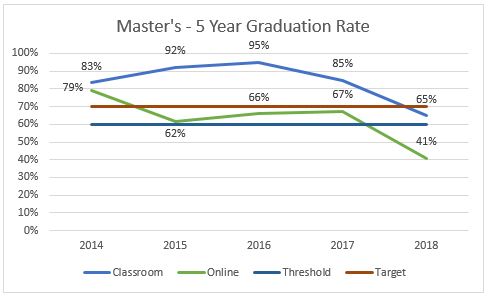
The SBMI target rate was met for all admit years for classroom students, except for 2018, as seen in Table 8.1.g and Figure 8.1.e. Given that the numbers were compiled in 2020, some classroom students are still completing their degree program. For the web-based students, SBMI met the 70 percent target rate in 2014, but not in AY 2015, 2016, or 2017; however, the graduation rates are above the 60 percent action threshold for these years. Many SBMI online students attend part-time as they are also working professionals, oftentimes with family. Thus, they are more susceptible to outside pressures causing them to discontinue their studies prior to completion. The lower graduation rate for 2018 for web-based students is due to a majority of web-based students taking courses on a part-time basis.
SBMI M.S. Graduation Rates by Delivery Method
SBMI M.S. Graduation Rates by Delivery Method
SBMI M.S. Graduation Rates by Gender
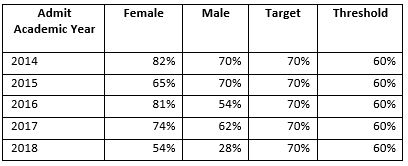
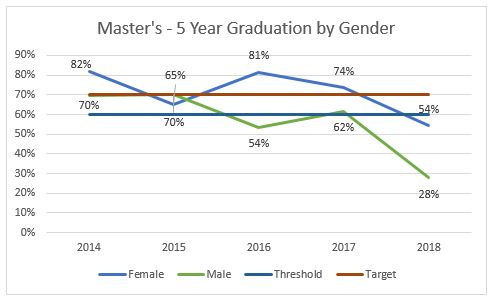
The SBMI M.S. 5 year graduation rates by gender can be found in Table 8.1.h and Figure 8.1.f. As can be seen, the female graduation rates are higher than the male graduation rates. In all years except for 2015 and 2018, the female graduation rates exceeded the target rate of 70 percent. Due to the part-time nature of a majority of SBMI students, the rates report for 2018 are incomplete. For the male students, the 5 year graduation rate for 2016 dipped below the Threshold for action; however, it rebounded above the threshold in 2017. SBMI is undertaking an in-depth analysis of the male students who fail to graduate within 5 years in an attempt to determine the reasons.
M.S. Graduation Rates by Gender
SBMI M.S. Graduation Rates by Gender
SBMI M.S. Graduation Rates by Race and Ethnicity
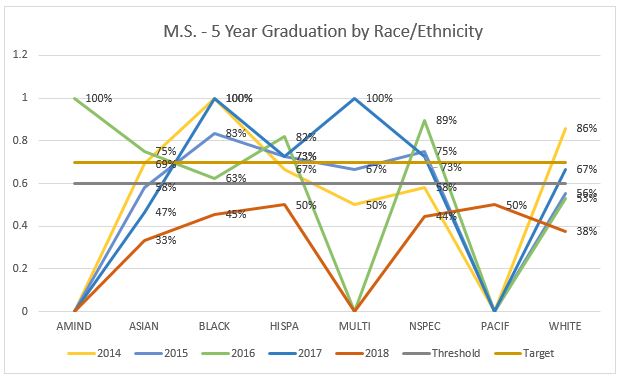
The SBMI graduation rates broken out by race and ethnicity are found in Table 8.1.i and Figure 8.1.g. Of the races, the student reporting their race as White did not meet the SBMI threshold of 60 percent in 2015 and 2016; however 67 percent of those beginning in 2017 graduated. The only other race below the 60 percent threshold twice are those who report as Asian, with 58 percent who started in 2015 completing and so far, only 47 percent of those completing in 2017 graduating. As can be seen, the graduation rates for 2018 remain incomplete. Given the lack of a trend over time, SBMI will continue to monitor the graduation rates by race and ethnicity.
SBMI M.S. Graduation Rates by Race and Ethnicity

SBMI M.S. Graduation Rates by Race and Ethnicity
SBMI Ph.D. Program
SBMI Ph.D. Retention Rates
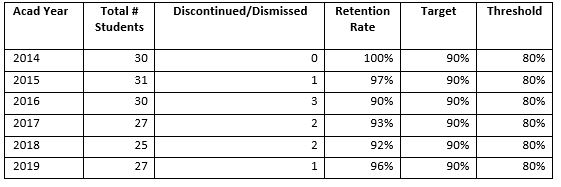
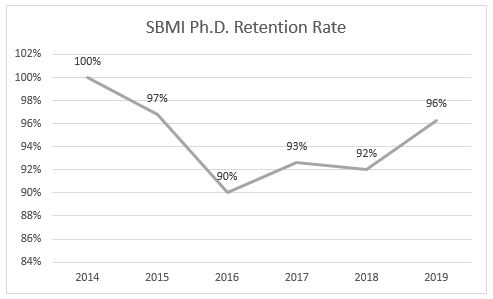
SBMI has a year over year target retention rate of 90 percent, with a threshold for corrective action of 80 percent. As can be seen in Table 8.1.j and Figure 8.1.h, SBMI met or exceeded the target each academic year. The SBMI Ph.D. program is currently a full-time, on-campus program.
SBMI Ph.D. Retention Rates
SBMI Ph.D. Retention Rates
SBMI Ph.D. Retention Rates by Gender
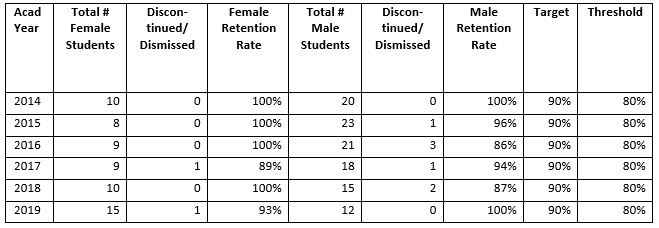
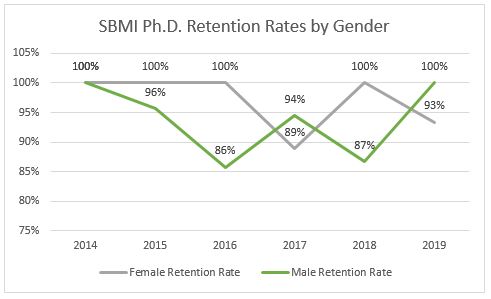
The SBMI Ph.D. program retention rates occasionally fall below the 90 percent target, but never below the 80 percent threshold. As can be seen in Table 8.1.k and Figure 8.1.i, depending upon the number of Ph.D. students of a given gender, losing even 1 student can result in a dip below the target as happened for the female students in 2017. The retention rate for male students fell below the target in 2016 and 2018. One male student in 2016 and one male student in 2018 elected to leave the Ph.D. program to pursue full-time work.
Ph.D. Retention Rates by Gender
Ph.D. Retention Rates by Gender
SBMI Ph.D. Retention Rates by Race and Ethnicity
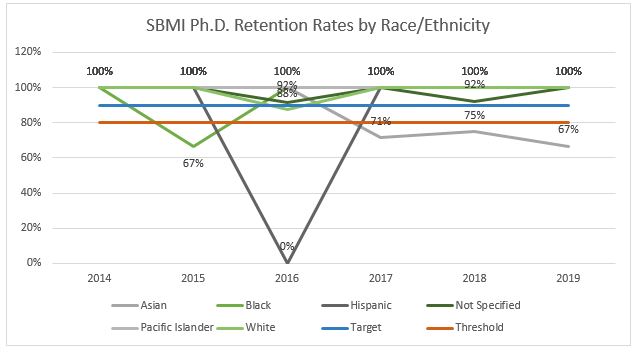
As seen in Table 8.1.k, SBMI averages from 25 to 30 Ph.D. students each academic year. When broken out by race and ethnicity, the numbers can be quite small. While SBMI strives to retain all students, the retention rates can fall below the threshold for action as seen in Table 8.1.l and Figure 8.1.j. For example, the 67 percent retention rate in AY 2015 for black students represents the loss of one student, as does the 0 percent retention rate for AY 2016, where the single Hispanic student left the program. Similarly, the 71 percent in AY 2017, 75 percent in AY 2018, and 67 percent in 2019 represent the attrition of 2, 1, and 1 students respectively.
SBMI Ph.D. Retention Rates by Race and Ethnicity

SBMI Ph.D. Retention Rates by Race and Ethnicity
SBMI Ph.D. Graduation Rates
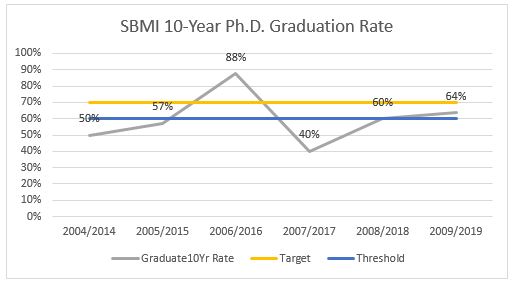
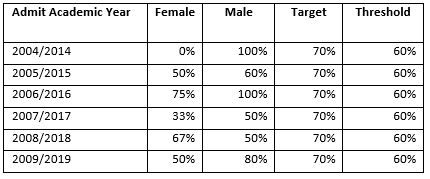
SBMI measures the Ph.D. graduation rate for Ph.D. students within 10 years. The target rate for graduation from the PhD program within a 10-year timeframe is 70 percent. The threshold requiring corrective action for the Ph.D. program graduation rate is 60 percent. The target goal was met in AY 2016 and the threshold was met in AY 2018 and 2019 as seen in Table 8.1.m and Figure 8.1.k. The school has added additional milestones to the Ph.D. program to ensure students progress in a timely fashion and graduate within the 10-year window. These changes were effective in Fall 2016. It is also noted that less than 10 students entered in any year from 2004 to 2008, thus, losing 3 Ph.D. students can result in rates at 50 percent or lower.
SBMI 10-Year Ph.D. Graduation Rates

SBMI 10-Year Ph.D. Graduation Rates
SBMI 10-Year Ph.D. Graduation Rates by Gender
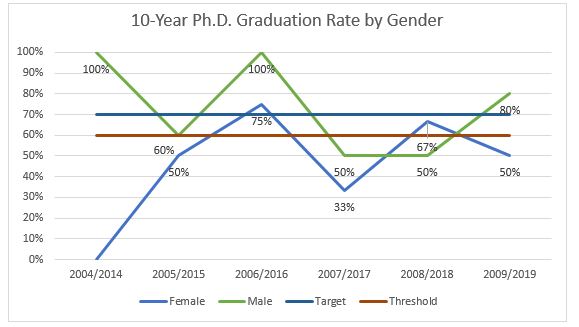
The SBMI 10-year graduation rates for Ph.D. students broken out by gender are found in Table 8.1.n and Figure 8.1.l. With the exception of the students who entered in 2008, the graduation rates for males was higher than for female students. Additionally, for many of the years included, the numbers are very small. For example, for the cohort that entered in 2007, three female students started the program, with only one completing the program. In both 2007 and 2008, two male students started each year, with only one student completing the program. As has been described previously, this failure to graduate has already been addressed by SBMI. Additional structure was introduced into the Ph.D. program with the cohort that entered in Fall 2016. This structure included additional required courses such as Advanced Research Design and Critical Review of the Literature to help the Ph.D. students build foundational skills while completing important portions of their dissertation proposal. Additionally, prior to 2016, there was only one milestone, advance to candidacy, for the Ph.D. students prior to dissertation defense. Beginning with the 2016 cohort, Ph.D. students are required to complete a qualifying exam with both a written and oral component.
SBMI 10-Year Ph.D. Graduation Rates by Gender
SBMI 10-Year Ph.D. Graduation Rate by Gender
SBMI 10-Year Ph.D. Graduation Rates by Race and Ethnicity
The SBMI 10-year Ph.D. graduation rates are found in Table 8.1.o. The rates with a zero percent indicate years in which all of the students of a given race who started failed to complete the Ph.D. program. With the exception of two students who did not specify their race or ethnicity who started in 2007, all cases with a zero percent represent a single student of that race entering the program who failed to complete the program. In 2005 the seven students who entered the Ph.D. program did not declare their race or ethnicity and only four of the students completed the program. Of the two Asian students who entered the Ph.D. program in 2009, only one student completed.
SBMI 10-Year Ph.D. Graduation Rates by Race and Ethnicity

Graduates Employed in Informatics
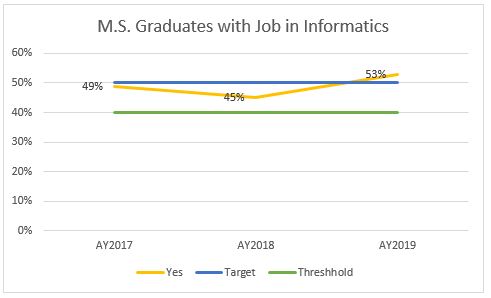
One of the goals of SBMI is “to educate current and future leaders, innovators, and problem solvers.” The field of biomedical informatics currently does not have a credential or licensing exam for its graduates, so SBMI is tracking the employment of graduates in the field of informatics. Given the diversity of the SBMI student body, with 23 percent of entering students already holding a professional degree such as the M.D. or Pharm.D; and 29 percent already holding a graduate degree, the M.S. target rate for employment in informatics is set at 50 percent, with a threshold of 40 percent set for corrective action. All students are required to complete an exit survey upon graduation from the M.S. and Ph.D. programs. Graduates are asked whether they have a job in informatics. Potential responses are Yes, No, N/A, or leaving the entry blank. The responses for the M.S. graduates from AY 2017 to AY 2019 can be found in Table 8.1.p and Figure 8.1.m. In AY 2017 and AY 2018, the rate of those reporting a job in informatics fell below the target rate, but above the threshold for corrective action. In AY 2019 the rate rose above the target rate. Those who graduated with the M.S. and reported they did not have a job in informatics (an answer of No), were employed in other areas in health care, for example, as a nurse or a physician. Some of those answering N/A were also employed in other areas of health care. Of the 21 who left the question blank, 4 have continued into the Ph.D. program at SBMI and 1 was a medical student.
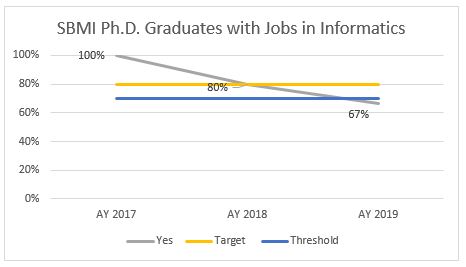
The Ph.D. target rate for students finding employment in the informatics field is 80 percent, with a threshold rate of 70 percent for corrective action. The rates are higher for the Ph.D. due to the additional study and specialization required for the Ph.D. program. As can be seen in Table 8.1.q and Figure 8.1.n, the target rate was met in AY 2017 and AY 2018. One Ph.D. graduate of the four total left the job question blank in AY 2018, resulting in the 80 percent rate. The 67 percent rate in AY 2019 falls below the threshold for corrective action. However, 33 percent answering N/A represents a single student as only 2 Ph.D. students graduated in AY 2019. SBMI will continue to monitor the employment for Ph.D. students. Should the rates remain below the threshold additional investigation will be pursued.
SBMI M.S. Graduates with Jobs in Informatics

SBMI M.S. Graduates with Jobs in Informatics
SBMI Ph.D. Graduates with Jobs in Informatics

SBMI Ph.D. Graduates with Jobs in Informatics


 Featured Donor

